Alex Luna • January 24th, 2024.
Coming off a record hot and dry spring, a dry Australian summer made sense to everyone – including weather forecasters! With an El Niño rapidly showing signs of forming after three summers in a row of La Niña, a flip to El Niño often trends drier, and may have brought up memories of the very dry and hot summer of 2019-2020.
Spring 2023 saw several record breaking heat waves and drought. However, this was actually associated with a weather phenomenon that occurs in the Indian Ocean and was expected to end by the start of summer. While It did end, it happened a little later than normal. That delay, plus the statement by the Bureau of Meteorology that an El Niño had in fact formed, was all it took to fan the flames of the narrative of a dry spring continuing into summer.
But this is not what happened. Because of a poor forecast, the market struggled as farmers and ranchers took preventative action to avoid potential losses, due to the projected heatwave and drought, based on what they had learned in 2019/2020. Some farmers even sold their cattle because they worried the yields of livestock feed would be too low to sustain their herds. Farmers are upset with the Australia’s weather bureau as they witnessed green pastures and recovering prices as rain fell.
So what happened? The answer is complicated and abnormal, but to break it down in the most simple terms, let us go over a little background about El Niño and the influences of the Antarctica Jet Stream and storm events in Indonesia.
Prior to the start of the Summer, the Bureau of Meteorology declared an El Niño had formed. Since that declaration, the El Niño has grown into what is considered a strong El Niño.
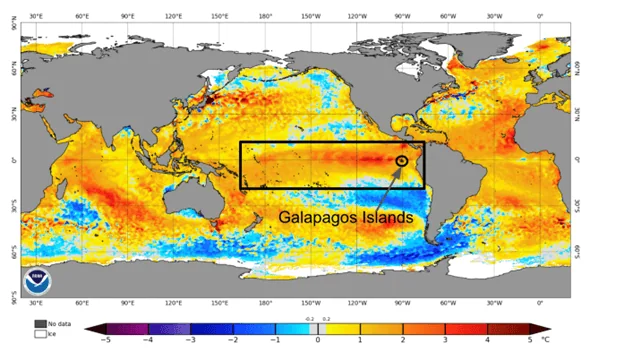
The El Niño is an area of water that is warmer than normal. It stretches along the Equator, from Ecuador to the Galapagos Islands, and extends almost to Indonesia in the western Pacific Ocean. In normal El Niño years, the core of much warmer water extends from Ecuador to about the Date Line or 180 degrees. Looking at the sea surface temperatures this year, compared to normal, on Figure 1 below, the area in the box is the El Niño region. The warmest differences start around the Galapagos Islands and go to about 130 west longitude, but not all the way across the Pacific Ocean. They also don’t quite reach the shores of South America.
The other thing you see this year are warmer than normal temperatures between Australia and New Zealand and from Darwin north across Indonesia.
Figure 1. El Niño forms inside the box area in 2023/2024. The Galapagos Islands are within the
El Niño region. Sea Surface temperatures are shown in the red to blue colors, with red being
above normal and blue being below normal in Celcius temperatures.
You can convert to Fahrenheit here.
A normal El Niño sea surface temperature pattern is warmer than normal from South America to about 180 west or the Date Line, as seen in the boxed area, and cool near eastern Australia/New Zealand and across Indonesia as can be seen in Figure 2. The El Niño this year is acting like a hybrid El Niño in that it’s still an El Niño, but it has slightly different characteristics.
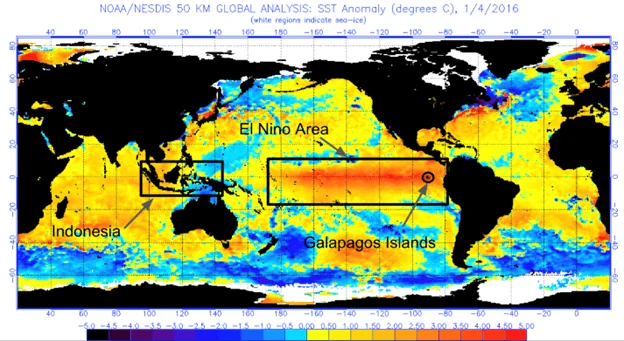
Figure 2. El Niño in 2015/2016 that was classified as a very strong El Niño with a normal looking sea
surface temperature (SST) pattern of warm water along the Equator and colder than normal water
between Australia and New Zealand and north of Australia into Indonesia. Warmer temperatures
are in red and colder than normal in blue, all in Celsius which can be converted here.
The El Niño and the water temperatures in the Pacific play an important role in the weather across Australia, but they are not the only drivers. Another area with a major influence on Australia is Antarctica.
Antarctica may just seem like a big chunk of ice that’s easy to forget about, but it plays a big part in the increasing rainfall in Australia. It’s a little over 2000 km from Tasmania to Antarctica.
There is a core of strong winds very high above the Earth’s surface that encircle Antarctica. These winds form a jet stream similar to the northern and southern streams in North America. Storms move west to east along the jet stream and bring cold and warm conditions to southern Australia, South America and Africa. This circular jet stream sometimes extends north, away from Antarctica. When this happens the storm track can bring colder air and some wet weather to all of southern Australia, but overall it is drier than when the jet stream stays close to Antarctica.
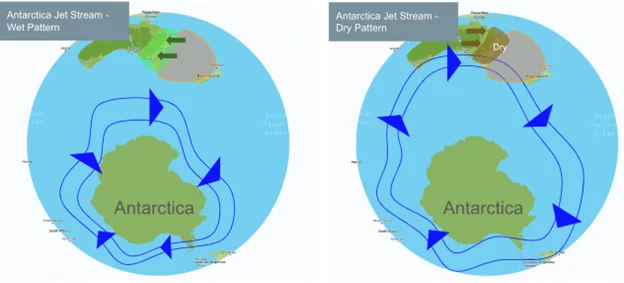
Figure 3. Antarctic Jet Stream, also known as the Southern Annular Mode (SAM), and
Antarctic Annular Oscillation (AAO) expands and contracts around Antarctica which brings increased
rainfall when contracted and less rainfall when it expands. On the left, east to west winds blowing over
warm water (orange) promote increased moisture (green arrows) and increased rainfall (light green area)
over Australia when the Antarctic Jet Stream is contracted or closer to Antarctica. On the right,
west to east winds blowing from land to sea (brown arrows) promote drier conditions for eastern
Australia (brown shading) when the Antarctic Jet Stream expands. When this jet stream expands,
more cold fronts and showers can develop across southern areas from Perth to Adelaide.
The Antarctica Jet Stream contracts more often during hybrid versions of El Niño and during the La Niña weather pattern. The warm water temperatures between Australia and New Zealand are a signal that the jet stream may contract.
There is one other type of weather pattern that can be associated with the wetter summer in Australia this year. That is the thunderstorms in Indonesia.
Indonesia is the area of islands between Asia and Australia that include Borneo and New Guinea and are where you would find Bali and Jakarta.
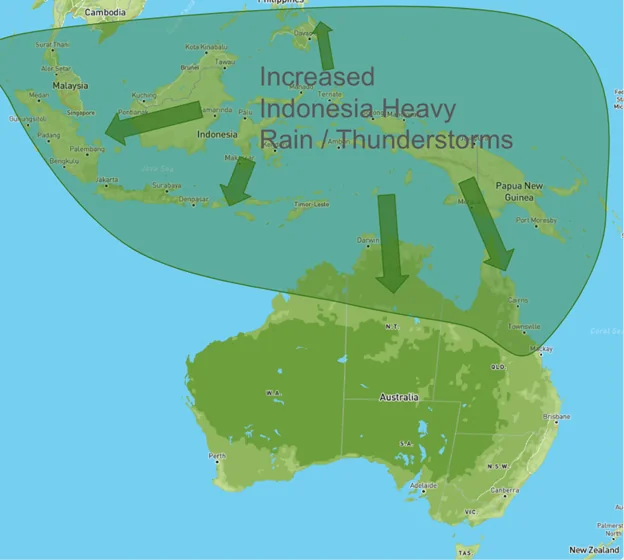
Figure 4. Heavy rain, thunderstorms, and increased tropical cyclone activity is associated with
a weather pattern called the MJO. When this is active northern Australia can see an increase in
heavy rainfall and flooding. This weather pattern will often move east and travel around the globe,
bringing rain and warmth to other locations in North America, Europe, and Asia.
Indonesia is the origin of a weather pattern, called the Madden-Julian Oscillation or MJO, that brings increased rain and thunderstorms to the region and surrounding areas. When this area is active, heavy rain and tropical cyclone activity increases in northern Australia. The MJO is most active during hybrid El Niños, and La Niña weather patterns. The MJO has been very active so far in January.
A combination of an active MJO with a favorable jet stream in Antarctica can lead to widespread areas of heavy rain and flooding across northern and eastern Australia. The occurrence of tropical cyclones, like Jasper and another one this week, increases for northeast Australia.
Nothing about this combination of weather patterns occurring all at once is normal, especially in a year with a strong El Niño. The unusual El Niño pattern is not only affecting Australia. Many regions of the world are experiencing strange weather patterns for an El Niño and this may ultimately end up changing how El Niño is viewed in the face of climate volatility.
Crops such as barley, wheat, canola, sorghum, and cotton are all expecting much higher yields than projected, due to the increased rainfall mostly across New South Wales and Queensland. The impact in the short term will likely be flooding rains from increased cyclone activity and periods of heavy rain in northern Queensland, where 200-500mm of rain may fall. Sugarcane, mangoes, and other crops grown in tropical regions could see the risk from damage in floods and the threat of subsequent fungal diseases. Crops susceptible to dramatic changes in water supply may see reduced quality because of higher than normal rainfall.
The El Niño is going to weaken by late fall (at the earliest) into the summer and transition most likely to a La Niña. La Niña is associated with increased rainfall in Australia and cooler temperatures. In addition, the warm ocean temperatures off the east coast of Australia and across Indonesia are unlikely to change much, especially if La Niña forms as it results in warm water in those areas. The only real wild card will be the phenomenon in the Indian Ocean and the jet stream around Antarctica.
Overall, signs are pointing to a continued wetter than normal weather pattern through the fall harvests and potentially lingering through the end of 2024.
For more detailed, customized forecasts for specific crops, reach out to ClimateAi.