Most people use weather forecasts on a daily basis — to figure out which jacket to wear, to decide whether to bring an umbrella, or to plan a hike. However, beyond these mostly benign personal concerns, a huge number of businesses from utility companies to farmers rely on weather forecasts to make multi-million dollar decisions on a daily basis. Therefore, reliable weather forecasts are crucial to maximizing profit and impact.
Reliable forecasts matter for a wide range of sectors: in the energy sector, they play a role in setting demand — cold or hot temperatures increase demand through increased heating or air conditioning — as well as in determining the supply of renewable energy. In agriculture, weather plays a role in every stage of crop production. During planting, it is important that soil temperature and moisture are just right. For harvesting, it is crucial to know the risk of rainfall or freezing temperatures. Naturally, this means that we need to forecast weather as accurately as possible. For this reason, huge amounts of money and effort are spent by public and private organizations in providing such forecasts.
But that’s often easier said than done, because nature puts a hard limit to how accurately one can forecast weather.
The reason for this is the butterfly effect, which postulates that even if we have a perfect model and we know the current atmospheric conditions with near-perfect accuracy our forecast will eventually drift further and further away from the actual weather. This means that while we can forecast with relative certainty whether it’s going to rain tomorrow, it is very hard to say with any kind of certainty whether it will rain a week from now. How uncertain a forecast is depends on the location, season and specific weather situation.
So the question arises: How can businesses make decisions if the forecasts are inherently uncertain? The answer lies in using reliable probability forecasts.
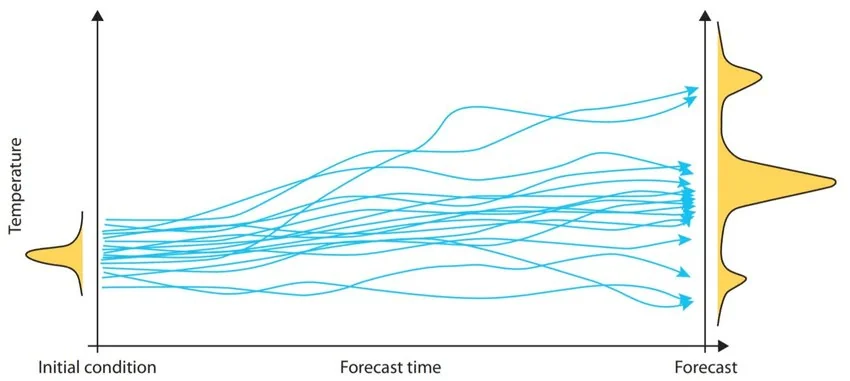
In a probabilistic forecast, instead of just predicting one potential future weather scenario (which might be off) we predict a bunch (usually around 50) of possible scenarios (see image below). In weather forecasting this is called an ensemble forecast. Using such an ensemble forecast allows users to attach an uncertainty range to a forecast of temperature for example, or to estimate the probability of a certain event occurring (e.g. the chance of rain). In the face of uncertainty, understanding such probabilities enables businesses to make the best decision and prepare for each potential situation accordingly. In a nutshell, decision-makers can weigh different decisions on a cost-loss analysis.
Let’s take a sorghum grower as an example. If temperatures drop below freezing, a large portion of the crops will die and the losses will be substantial. However, harvesting early to avoid a potential freeze comes at the cost of not giving the crop time to bulk up and therefore reducing the profit.
Probabilistic forecasts allow growers to weigh the options statistically. If the forecasted chance of freezing is only 5%, it might well be worth taking the small risk of allowing the crops to bulk up. However, if the chance is 40% the cost/loss ratio will probably say that this is too risky and harvesting early is the smart decision. One important thing to consider is that these considerations always apply in the statistical average over many cases. Even if the forecasted chance is 5%, in one of twenty cases it will freeze, and growers will take a heavy loss but over many years of applying this method, statistically one will most likely end up with a profit.
(For more information on cost/loss analyses, see: Cost-loss model)
So we have seen how probability forecasts can be a tool for making informed decisions. That’s only one part of the equation. However, in order for them to be useful, they need to fulfill one crucial criterion: reliability.
Reliability is, in fact, a mathematically defined property that examines whether the forecasted probabilities match how often a particular event actually occurs. Let’s take the example of forecasting freezes again. If we look at all the forecasts made over the last few years and collect all days for which the forecasted probability of freezing was 30%, then it should also have frozen in 30% of these days. Otherwise the forecast is unreliable. Weather forecasters typically look at a reliability diagram which performs this analysis for each probability (see image below). Good forecasts, such as the one shown in the figure below, closely follow the one-one line on such a diagram.

Example of a reliability diagram for forecasting heat waves. On the horizontal axis, the forecasted probabilities are shown. On the vertical axis, are the corresponding actual probabilities. A good forecast should closely follow the diagonal line.
At ClimateAi, we value truthfulness and transparency of providing value to our customers over everything else. Nature prohibits us from making a 100% accurate forecast weeks ahead. Thereby, communication of scientifically credible forecasts with interpretable uncertainties and probabilities of scenarios is the foundation of how we work with our customers to improve decision making and provide unparalleled business value.