Alex Luna • January 31st, 2024.
While rain has been falling on a daily basis across the farming regions of Brazil, the spring drought was so severe that soil moisture levels haven’t come close to recovering.
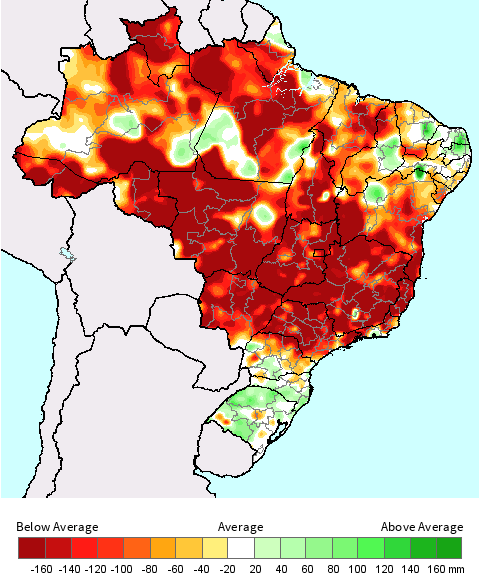
Fig 1. Climate Prediction Center (CPC) Soil Moisture Anomaly as of Jan 25, 2024
This was especially important from sowing to the vegetative growth stage of the soybean growth cycle, when water stress can have the most impact. The yield numbers will be better than it looked in the spring, but production will be lower year-on-year.
It’s easy to point fingers at the El Niño as the reason for the dry spring and the subsequent dry soil, but although the El Niño definitely had a role, it likely wasn’t the primary cause. Altogether, this was a 3-part process that led to the dry, hot spring.
The weather pattern can shift dramatically from year to year when El Niño and La Niña are active, as they have been the last 4 years. Three years of La Niña followed by a sudden shift to a strong El Niño this year completely turned around one of the most drought-stricken soybean areas, Rio Grande do Sul, into the wettest, while other areas changed from wet to dry.
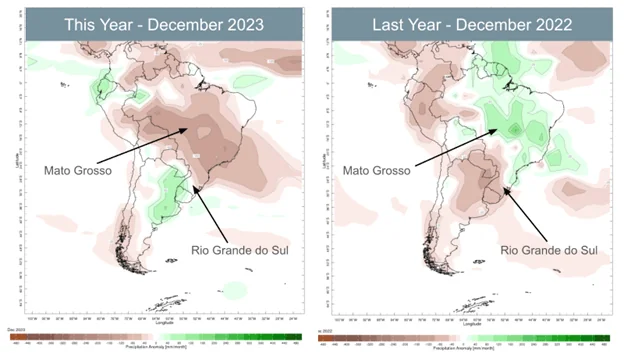
Fig 2. Precipitation Anomaly [mm/month]. Top producing region
Mato Grosso and third largest Rio Grande do Sul shown
with arrows. Also note the rest of Brazil completely
flipped from wet last year to dry this year.
The Indian Ocean extends from Africa in the west and Indonesia in the east, with India in the north. When ocean surface temperatures are warmer than normal near Africa and colder than normal near Indonesia, you get what is called the Positive Indian Ocean Dipole (+IOD).
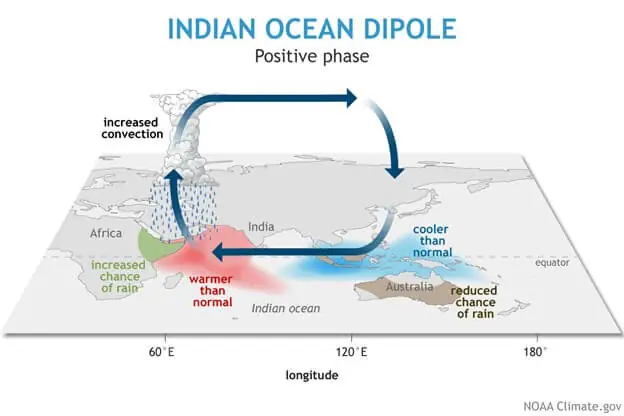
Fig 3. Diagram showing Positive Indian Ocean Dipole (+IOD).
This weather pattern extends to the Atlantic Ocean and affects South America.
Convection as indicated here with a cloud means rain or thunderstorms
and this is more likely when air rises in warm, moist air. On the other side,
air sinking towards the earth creates dry conditions as seen in
Australia. This same effect is what dries out Brazil.
In Fig 3 above, the warmer water in the western Indian Ocean promotes more rain and thunderstorms (convection) over eastern Africa, while sinking air towards the ground lowers rain chances across Australia and Indonesia. This weather pattern basically alters the jet stream and the way in which storm systems move around the world. When the jet stream moves across South America it creates the same sort of sinking motion you see in Fig 3 over Indonesia, but over much of Brazil. This creates dry, hot days with heat stress. At the same time, rising, warm, humid air is creating heavy rain for southern Brazil, Uruguay, and parts of Argentina. The IOD pattern normally ends around December, and that was the case this year as well, which is why the spring was so dry but heavier showers returned for many areas in January.
A third contributing factor, which amplifies the IOD, is warmer than normal ocean temperatures off the southeast coast of Brazil. The ocean does not heat evenly and much of this is associated with ocean currents that move water around the globe. Different currents are known to be warm or cold as you can see in Fig 4 below.
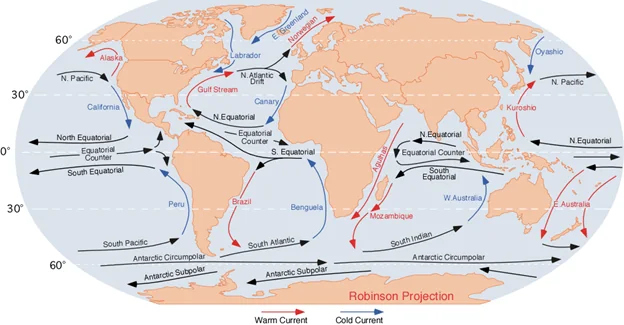
Fig 4. Ocean currents. Blue is cold currents. Red is warm currents.
Black is not warm or cold. Arrows dictate the direction the water is moving.
Ocean currents are vital to the health of the oceans and land and are completely normal. However, what is not normal is the increasing pools of very warm ocean water that can stay in one spot for several months or longer. These are known as Marine Heat Waves (MHW). There is one MHW just off the southeast coast of southern Brazil, which is circled in the sea surface temperature graphic in Fig 5.
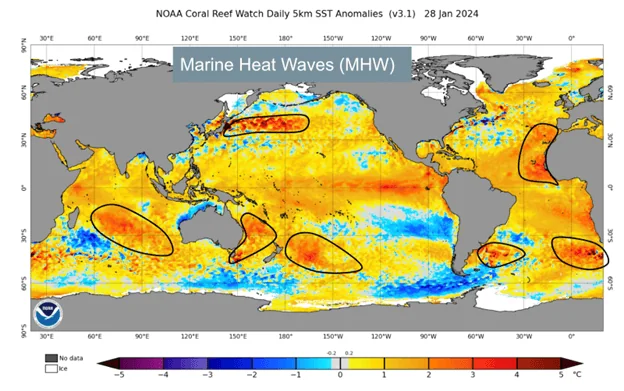
Fig 5. Sea Surface Temperature Anomalies in Jan 2024.
Circles represent areas of much above normal water temperatures and
the location of Marine Heat Waves (MHW). MHWs can
alter weather patterns when they are near land.
The way these parts all come together is the IOD creates an area of what is known as High Pressure (H) and that is air moving towards the ground and increasing the pressure of the air on the ground. The winds in these areas are light and often diverging or moving apart from each other. This prevents clouds from rising to create showers and thunderstorms and it allows direct sunlight most of the day which leads to hot days and nights and drier soil. The high pressure area forms near the marine heat wave and just offshore of Brazil. To the west of the high pressure, and due to the location of the Andes mountains you get winds that are converging or moving toward each other and the air is forced upward or in a rising motion. This is what creates clouds, showers, and thunderstorms.
The role of the marine heat wave is to make the high pressure stronger which allows it to stay in the same location for longer and prolong the heat and drought in the same areas for most of the spring and keep heavy rain over southern Brazil at the same time creating completely different experiences for farmers. Fig 6 below shows how the IOD, MHW, and high pressure work together.
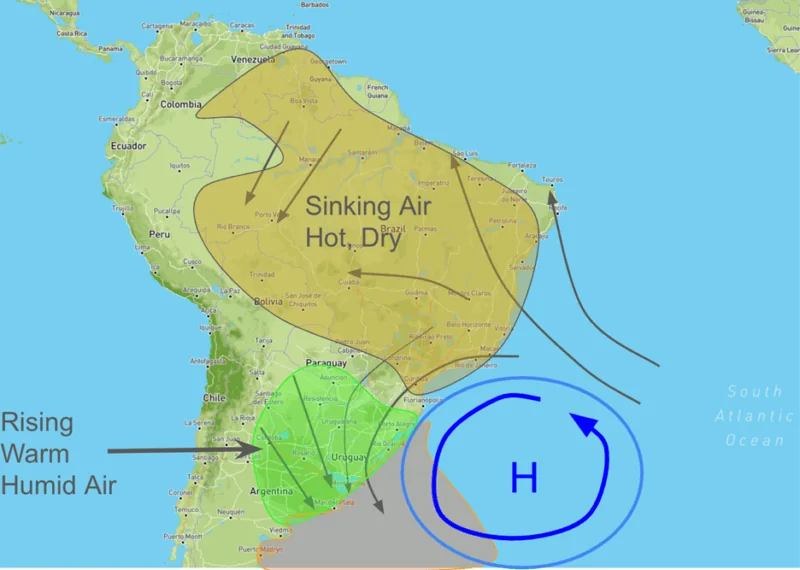
Fig 6. High pressure off the southeast coast of Brazil. Winds around high pressure
in the southern hemisphere move counter-clockwise. Lines with arrows
represent winds blowing towards the direction the arrow is pointing.
Diverging winds are pictured over the hot, dry areas, while converging
winds create rain showers in the green area. The marine heat
wave is in orange, just offshore.
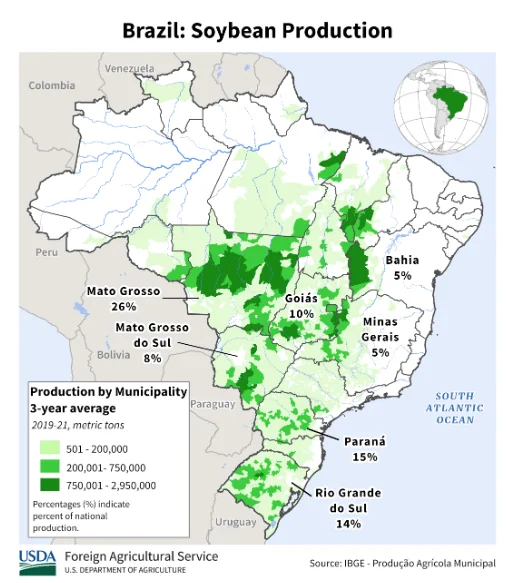
The difference between this year’s El Niño and last year’s La Niña is clear when you compare Brazil and Argentina to last year’s production numbers. Soybean yield is expected, by the USDA, to increase 75% in Argentina compared to last year. This is because Argentina received higher than normal rainfall this year, but last year in a La Niña pattern, precipitation was below normal, as can be seen on Fig 2. Brazil, meanwhile, is expecting as much as a 5% yield drop from last year due to the drier than normal conditions in October through December. Below in Fig 7 you can see how Mato Grosso is the leading soybean area in Brazil, while Rio Grande Do Sul, which saw much more rain, is the third highest producing area.
Fig 7. Three-year average soybean production by municipality in Brazil.
As El Niño is already starting to show slight weakening, and with an expected more rapid end by late in the fall season or early winter, how should farmers prepare for sowing in June to September? The short answer is La Niña is likely to make a return for spring/winter 2024/2025. However, significant uncertainties exist around the timing of a change, the strength and duration, and which region will see the biggest impact.
Here at ClimateAi, our expert team of agricultural, data, and climate scientists have the answers to these unanswered questions and can provide weekly, monthly and seasonal crop-specific forecasts for your location.