A Very Brief History of Seasonal Climate Forecasting for Agriculture
Alex Luna • February 7th, 2020.
Farmers have searched for ways to predict weather and climate since the dawn of agriculture 10,000 years ago. Weather is the short-term fluctuation (i.e. from seconds to weeks) in variables like temperature, precipitation, humidity, cloudiness, etc., and climate is the long-term average (i.e. typically thirty years) of these variables at a given location. To see the probability of having rain or a frost tomorrow, farmers, today typically referred to as growers, rely on a weather forecast. To estimate how conditions favorable for agriculture may change over the 21st century, they must rely on projections from global climate models. Between these two timescales lies the realm of seasonal climate variability and forecasting. To determine what seed to plant, when to plant it, or when harvest will occur, growers can consult a seasonal climate forecast.
While modern weather forecasting dates to the 1950s, modern seasonal climate forecasting has only been available to growers since the late 1990s. Before this, and even today, seasonal climate forecasting has been based on everything from the Old Farmer’s Almanac and Punxsutawney Phil, to the coloration of wooly bear caterpillars and the thickness of onion skins. Despite claims to the contrary, these methods are less than reliable.
Today, most growers use historical “climatology” to forecast what the upcoming growing season will look like. They predict that the upcoming season’s temperature and precipitation will be the same as the average of the last 5, 10, or 30 years.
While this approach does capture the seasonal climate cycle driven by the Earth’s orbit, it fails to capture long term trends associated with global warming and the months-to-decade scale fluctuations driven by oceanic and atmospheric oscillations that impact the land surface (i.e. teleconnections) such as the El Niño-Southern Oscillation, the North Atlantic Oscillation, and the Indian Ocean Dipole, among many others. These fluctuations can have significant impacts on agriculture; the heavy spring rains in California and the US Midwest in 2019 are a salient recent example.
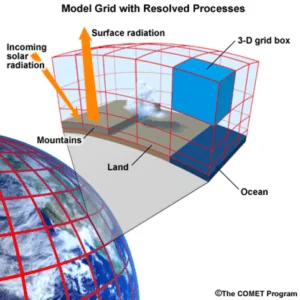
Fortunately, over the last three decades seasonal climate forecasting using dynamical models has moved beyond the research realm and into operational settings (e.g. NOAA’s CPC CFS and ECMWF’s SEAS systems). Dynamical models are gridded, fully coupled atmosphere-ocean-land models that use mathematical representations of the laws of physics to simulate the movement of heat, momentum, and water fluxes between grid boxes (see Fig. 1).
Figure 1. Schematic of a dynamical model used for seasonal climate prediction courtesy of UCAR COMET Program.1
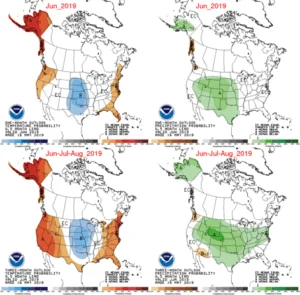
Multiple surveys have shown the value of seasonal climate forecasting for the agricultural sector (e.g. CIE’s 2014 report on Australian agriculture and WMO’s 2007 CAgM Report №102), and some growers do consult NOAA’s CPC forecast (see Fig. 2), but many remain skeptical of dynamical model forecast accuracy. This is due, in part, to past forecast misses such as the failure to forecast the 2012 Central US drought.
Figure 2. Tercile temperature and precipitation forecast maps courtesy of NOAA CPC.2
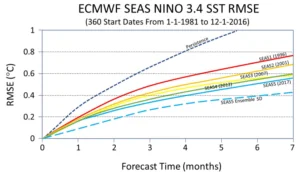
Since 1996, when ECMWF’s seasonal climate forecasting model SEAS1 was operationalized, each successive generation of models has shown steady improvement in forecast accuracy due to better data coverage and better models (see Fig. 3).
Figure 3. Evolution of ECMWF SEAS NINO 3.4 forecasting accuracy. Redrawn with data courtesy of ECMWF.3
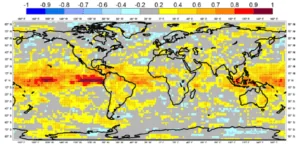
Despite these improvements, the forecast accuracy of dynamical models still varies greatly by both season and geography as well as the variable being forecast. ECMWF’s latest seasonal forecasting model, SEAS5, has high skill for near-surface temperature over the tropics, particularly over the oceans, but in extra-tropical regions, its accuracy is more variable (see Fig. 4; darker red indicates greater accuracy).
Figure 4. Anomaly correlation map of the SEAS5 ensemble mean 2 m temperature forecast with one month lead time for June-July-August (ERA-Interim 1981–2016). Figure courtesy of Johnson et al. (2019) ECMWF.4
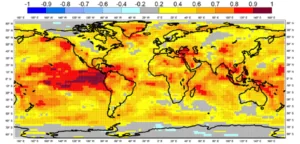
The accuracy of seasonal precipitation forecasts, of great importance for rainfed agriculture, is much more variable and significantly lower than the accuracy of near-surface temperature forecasts (see Fig. 5; darker red indicates greater accuracy). Unfortunately, the accuracy of the current generation of dynamical models is still particularly low over mid-latitude continental regions such as the US Midwest where significant agricultural activity occurs.
Figure 5. Anomaly correlation map of the SEAS5 ensemble mean precipitation forecast with one month lead time for June-July-August (GPCP v2.2 1981–2014). Figure courtesy of Johnson et al. (2019) ECMWF.5
Data-driven approaches using machine learning offer a potential pathway for improving seasonal climate forecast accuracy. Dynamical models are based on fundamental physics, but they also incorporate hundreds of semi-empirical relationships to approximate processes such as cloud formation that are too fine for the models to resolve. These relationships are ill-constrained and represent a major source of uncertainty and model error. Machine learning may be able to circumvent this long-standing problem in several ways. First, machine learning algorithms may be able to better represent the fundamentals of these sub-grid climate processes and thus used to supplement and improve the dynamical models. A second, more radical possibility, is that machine learning techniques might improve the accuracy of predictions while abandoning the scaffolding of traditional dynamical models altogether. For example, convolutional neural networks learn spatial patterns in global climate, and recurrent neural networks learn how these patterns evolve through time; neither requires information on the underlying governing physics. There is hope that both strategies, as well as many others, will improve seasonal climate prediction and ultimately help growers make the decisions that feed the world.
Copyright Disclaimer Under Section 107 of the Copyright Act 1976, allowance is made for “fair use” for purposes such as criticism, comment, news reporting, teaching, scholarship, and research. Fair use is a use permitted by copyright statute that might otherwise be infringing. Non-profit, educational or personal use tips the balance in favor of fair use.