New Product Launch: ClimateLens Monitor Yield Outlook - see regional and location-specific yields on key commodity crops, updated weekly.Learn More
Scott Patterson • April 10th, 2024.
The Madden Julian Oscillation is just one of many lesser known weather patterns with a global reach. Joining the MJO are the NAO, AO, IOD, SAM, AMO, PDO, EPO, and QBO to name a handful. While knowing the meaning of these acronyms is not necessary for most people, the MJO plays such a significant role in weather extremes worldwide that it should be as recognizable as El Niño and La Niña.
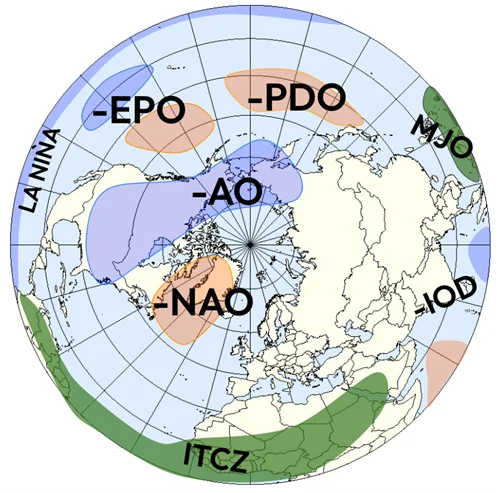
Map of the world showing the different types
and locations of global weather patterns.
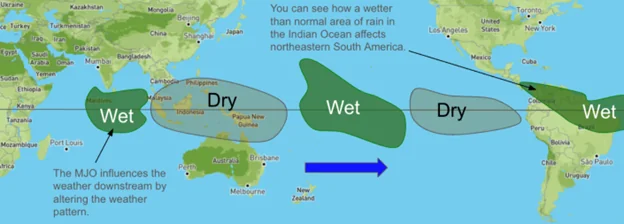
The MJO is a group of rain showers and thunderstorms that congregates across Indonesia and the Indian Ocean along the equator, north-northwest of Australia. Once it develops, the entire pattern moves eastward into the Pacific. Dry air precedes the arrival of the MJO and follows in its wake. Lurking in the shadows, this pattern of dry, wet, dry traverses the world, causing mayhem wherever it touches.
Image showing how the MJO in the Indian Ocean
influences the weather in Brazil.
Like the villain in a superhero comic, the MJO causes extreme heat waves, drought, tornado outbreaks, increased tropical cyclone activity, and intense flooding. Atmospheric rivers, weeklong heat waves, low humidity, wildfires, and blasts of arctic air can all be linked to the MJO.
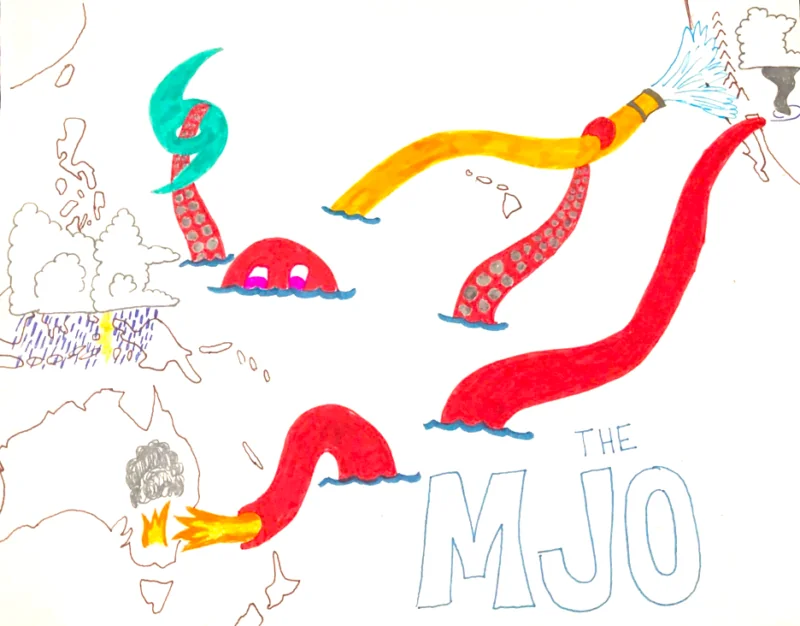
The MJO as a Climate Supervillian – Artist Credit: Scott Patterson
The MJO doesn’t actually move around the entire world, but instead interacts with other global patterns. When the MJO combines with other global patterns, no area of the world is safe. As the MJO moves, it goes through 8 phases (1-8), but it doesn’t have to move in order or go through every phase. Sometimes it will start with phase 3 and only go to phase 7 before weakening and starting over. Each phase is associated with certain types of impacts around the world.
Below are the 8 stages and the immediate effects on precipitation patterns. There is a winter and summer version of the MJO, with the northern hemisphere summer depicted here.
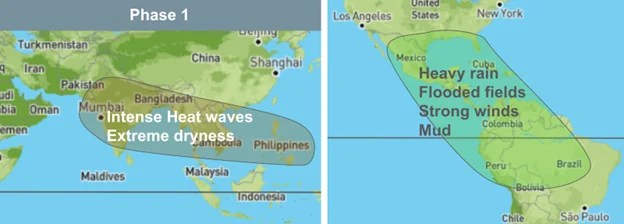
MJO Phase 1 Summer: Dry and hot conditions develop from India to the
Philippines, while in the Americas, excessive rainfall causes fields to flood,
making them inaccessible and washing away critical soil nutrients.
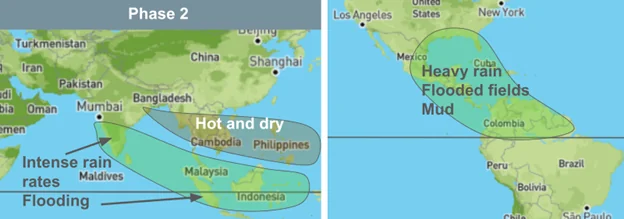
MJO Phase 2 Summer: Left: Dry conditions shift east out of India, but
still persist over southeast Asia. Phases 1+2 can significantly affect crops,
such as palm plants in southeast Asia, through heat stress and low soil moisture.
Heavy rain increases in southern India, Malaysia, and Indonesia. Right: Heavy
rain, while good for the Panama Canal, can continue to cause
flooding over northern South America, Mexico, and the southeast US.
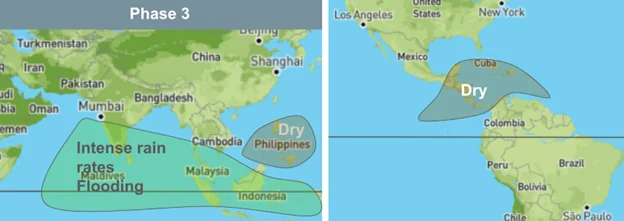
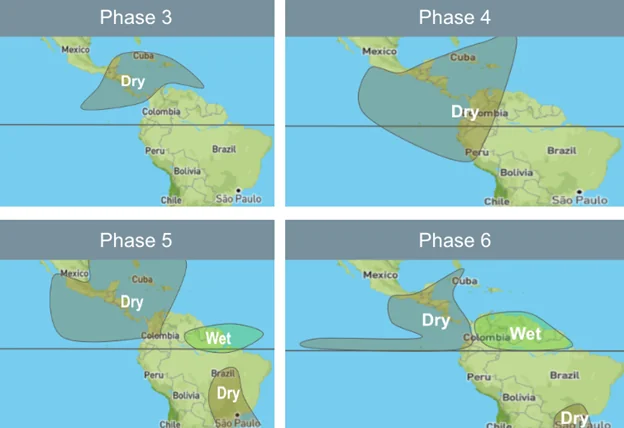
MJO Phase 3 Summer: Left: The Philippines remains in the drier than normal
area through phase 3, which if combined with phases 1 and 2, can lead to 3 weeks
of dry conditions, even in the wet season. Right: The other big change
is dry conditions developing in Central America including the Panama Canal.
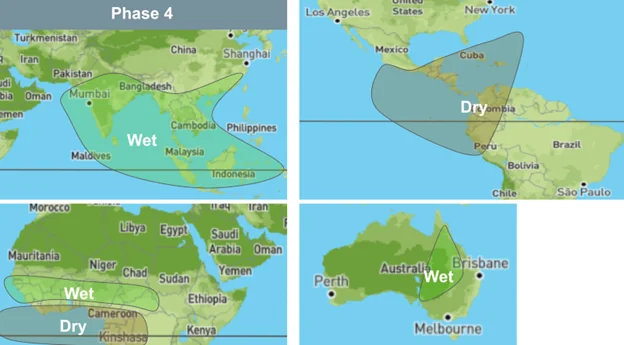
MJO Phase 4 Summer: Top-Left: Periods of heavy rain and flooding,
which when occurring during the monsoon or tropical weather can lead
to complete loss of crops, extreme high water, and mud. Top-Right: Dry
conditions continue in Panama, which during the wet season can
trigger a longer-term drought. Bottom-Left: Shifts in seasonal
rainfall can lead to lower crop yields and higher market prices
for crops like cocoa and coffee. Bottom-Right: Heavier than normal
rainfall can occur in much of New South Wales/Queensland.
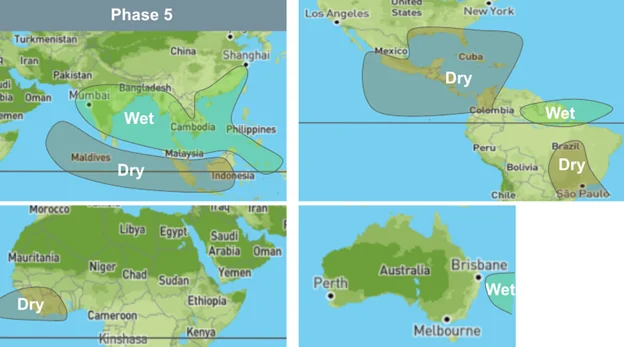
MJO Phase 5 Summer: Top-Left: India along with southeast Asia continues
to see periods of above normal rainfall, while drier than normal
conditions return to Indonesia. Top-Right: Dry weather continues
across Central-America along with another dry area from Mato Grosso Brazil
south to Sao Paulo. Wetter than normal weather develops along the Equator
in an area of cocoa trees. Bottom-Left: Below normal precipitation lingers in
western Africa, near cocoa farms along the Ivory Coast. Bottom-Right: Not a
strong signal in Australia, but wetter conditions develop near
Brisbane and extend southeast to New Zealand.
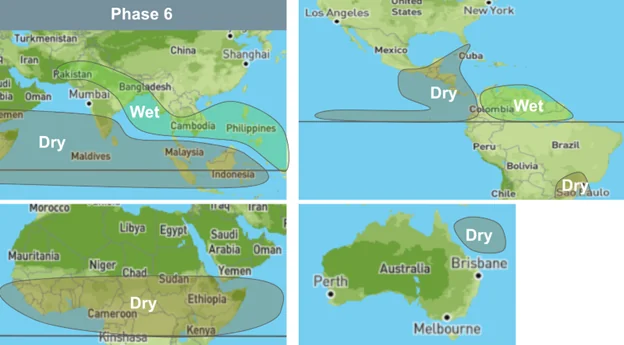
MJO Phase 6 Summer: Top-Left: A drier pattern for the Indian Ocean,
with a swath of wetter than normal precipitation persisting from northern
India to the Philippines. Drier than normal conditions in
southern India and Indonesia combined with other patterns can
lead to extreme heat waves. Top-Right: Continued dryness for Central
America, while the drier conditions in Brazil shrink down to only the
Sao Paulo region. Bottom-Left: Drier conditions return to Africa and can have
a significant impact on crops by shifting the timing of the wet season.
Bottom-Right: Drier weather offshore of Queensland
Australia, but no significant signal on land.
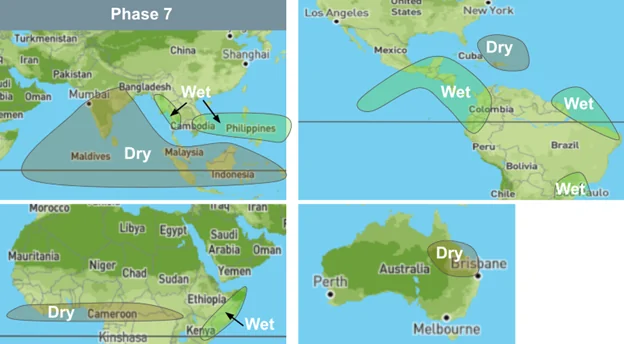
MJO Phase 7 Summer: Top-Left: Drier conditions have moved from the Indian
Ocean over much of India and Indonesia, which can lead to a week or so of drier
than normal, or enhancing an already existing drought. Top-Right: Dry conditions in
Central America finally see some relief with periods of wetter than normal weather.
Bottom-Left: Dry and hot for much of the Ivory Coast, while wetter for
the Horn of Africa. Bottom-Right: A dry pattern for northeast Australia.
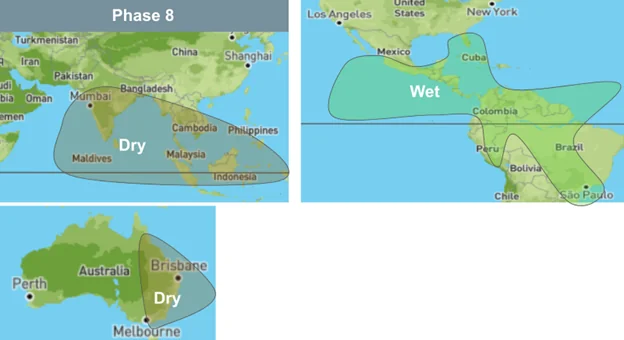
MJO Phase 8 Summer: Top-Left: Dry conditions from India to Indonesia.
Top-Right: Phase 7, becomes even wetter than usual
from Mexico to Brazil and much of Central and South America.
Bottom-Left: Dry conditions begin for much of eastern Australia.
When the MJO joins forces with other global weather patterns, extreme weather events are the result. There are so many different ways weather patterns can combine with the MJO to wreak havoc and cause climate volatility. This is largely dependent on where the weather patterns are located and when they occur.
The main weather event every year in India is the monsoon. Monsoon season usually starts the last week of May or first week of June in the south and by the start of July in the far north. Typically, monsoon ends in September. After peak heat during April and May, the monsoon brings much needed rainfall for plants, animals, and people. Any variation in timing or strength can have significant implications for people who plan around the monsoon.
The MJO in phases 7, 8, and 1 are very dry for India. The opposite is true in Phases 3, 4, and 5, which produces wet weather. In the south, Phase 2 and Phase 6 are wet. When these phases occur with no other pattern around, precipitation anomalies like these occur. Crazy weather events can occur when other patterns are ongoing and combine with the MJO.
The IOD or Indian Ocean Dipole, is a pattern of warmer water near Africa and colder water near Australia in the positive and wet phase for India. Starting in June or July, the IOD goes through December, peaking in September/October. In 2023, a positive IOD resulted in a chaotic monsoon where heavy rain unexpectedly occurred in the north. Southern areas were dry and then heavy rain areas moved around the country. Areas that saw drier than normal weather also experienced record heat. This year a less positive IOD is expected, which again may cause some variations to the monsoon.
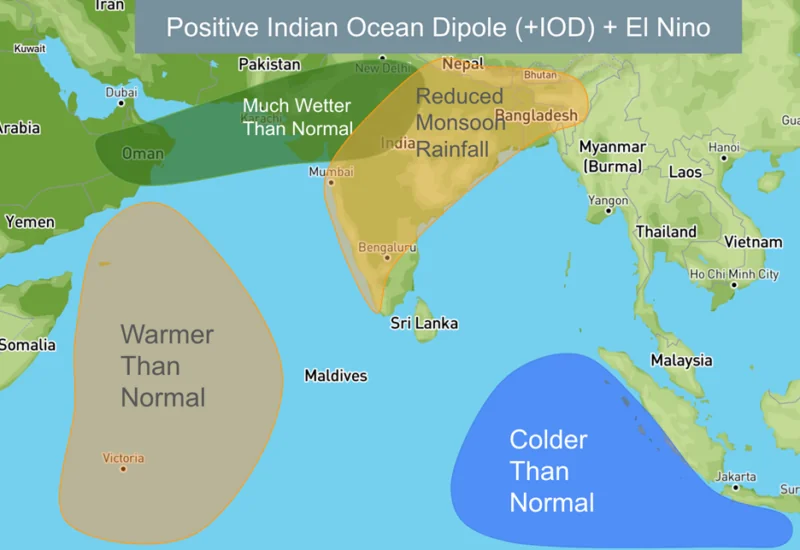
Positive IOD and El Niño. The impacts in India will likely be reduced,
but are still a factor creating another summer of chaotic heavy
rainfall in some areas, drought in others and hot temperatures.
A positive IOD suppresses the MJO. A negative IOD enhances the MJO. In 2024, a weak positive IOD is expected between May and September or even through the entire monsoon. So this means the MJO will be less active for India, but the IOD will be more active. The IOD will increase rainfall chances again and behave similarly to last year, but it will not be as strong. Although the El Niño will be ending in May, there still may be lingering effects through June and July. This behavior will mimic last year’s weather.
Tomatoes had an up and down year with farmers dumping their harvests in the road after market prices dropped too low to make a profit. Later in the year, the chaos of the monsoon led to prices too high for most people to afford them. Rice had a poor year, due to the El Niño and likely the +IOD, along with the MJO in dry phases. High prices forced the Indian government to ban exports of rice, which caused ripples through the world market. Other crops such as sugar and pulses also experienced lower yields due to dry conditions.
The MJO is most active in Australia during the late spring into summer. This typically occurs from November to March. The MJO on its own brings heavier than normal rainfall for the tropical coast and increases the chance of a tropical cyclone developing. This is what happened in December 2023, with cyclone Jasper. Jasper brought substantial damage and heavy rainfall to northern Queensland, although heavier rainfall can occur from tropical cyclones in other provinces as well.
Last year the IOD was very positive and, combined with the El Niño, created a very dry spring. Combined with record heat and drought, this brought early fears of the brush fires of 2019/2020. The IOD peaks in September/October and then ends by December, the start of summer in the southern hemisphere.
In 2023, the IOD (which is known to suppress the MJO) brought heat and drought in the spring. As soon as the IOD ended over the summer in December, the MJO rapidly gained strength and brought periods of heavy rain and flooding to eastern areas. This sudden change to wet weather caught many farmers by surprise, but ultimately led to better crop yields.
The SAM or Southern Annular Mode (aka Antarctica Annular Oscillation or AAO) is a jet stream or storm track that traverses the south pole. When this jet stream remains tight and fast around the pole, the SAM is positive. When the SAM is in a negative phase, it slows down and begins to meander more to the north towards Australia. In a positive phase it brings more rain to eastern Australia, mainly NSW and Victoria, and in a negative phase it is the opposite. This was likely part of the reason 2023 December into this January were so wet for eastern areas.
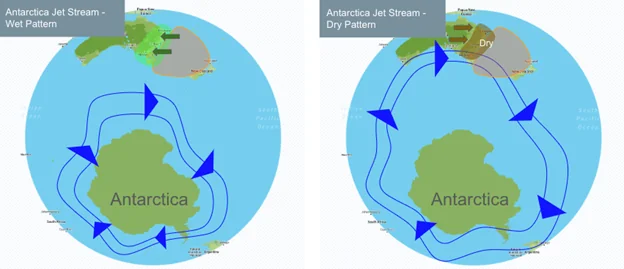
Two phases of the SAM or AAO and their impact on
weather for eastern Australia.
Australia was fortunate in how the weather played out in 2023. The El Niño was thought to bring dry conditions all summer. Early on, it appeared that was the case, with record heat and drought in the spring. However, the El Niño wasn’t causing the dry spring. It was the +IOD and the IOD was suppressing the much wetter MJO and the SAM. Once the IOD ended in December, the wetter phases of the MJO went bonkers and combined with very warm temperatures in the Coral and Tasman seas. The SAM also cranked up, generating daily heavy rain showers and thunderstorms for most of the eastern regions.
Wheat was having a really bad year in the spring, but then summer came and the rains turned the entire harvest around so much that higher than expected yields occurred. Other crops like barley, canola and sorghum also benefited from the increase in rainfall and saw higher production numbers in 2024.
The canal’s locks are filled with water from primarily Gatun Lake, which is running well below normal. This has led to less ships being allowed to travel between the Caribbean Sea and the Pacific Ocean. The canal operators are anticipating the start of the rainy season, which starts in May and runs through November. They are hoping this will bring enough rain to return to normal ship passage numbers. Last year’s El Niño combined with a positive IOD led to this year’s conditions. Luckily, a La Niña will return after August and the second half of the wet season should start to see above normal precipitation and increase ship traffic. Until then, the MJO is the outside factor that could extend the drought, but also bring intermittent periods of heavier rains.
While the MJO starts in the Indian Ocean and Indonesia, it spreads east all the way into Central and South America. This brings above normal precipitation in phase 1, 2, 7, and 8. All other phases bring below normal precipitation. Each MJO event lasts about 30-60 days as it moves around the world. Every MJO event doesn’t have to be strong and they can lose strength traveling across the Pacific, but the effects they unleash are often different than the ongoing weather pattern. Currently the MJO has been active and stronger every 30 days or every other month and favoring the dry phases for Panama over wet.
The next MJO event will arrive near the end of April to the start of May. Right now the biggest concern is that the dry phases will be the most active, essentially squashing the start of the rainy season. This would keep the lower ship traffic numbers stretching into June. This will also potentially create a bottleneck in the canal, as shipping companies start to ramp up the number of ships using the canal.
Dry phases of the MJO for the Panama Canal. A big risk for the start
of the rainy season and through the rest of 2024. One to two week periods of
drier than normal weather could offset the gains made
and keep reduced ship traffic into 2025.
The MJO, an amphibious force lurking in the shadows of the La Niña and El Niño and causing sudden bursts of catastrophic impacts to the world’s food supply, doesn’t have to be so secretive. The more you know about how it forms, how it moves, and which areas it affects most often, the better you can mitigate the havoc it may create. To be more prepared and have the best chance of protecting your harvests, reach out to ClimateAi where we are monitoring the MJO and all global weather patterns.